
Turkey, which is the 4th largest natural gas market in Europe, has an annual gas consumption of approximately 50 bcm. However, its gas input capacity is approximately 80 bcm. Our country, which has an LNG input capacity of approximately 20 bcm with 2 LNG terminals and 3 FSRUs, also has a domestic production of approximately 1 bcm. In light of this data; it is an important trade center with existing and planned pipelines between production and consumption centers, as well as maritime transportation.
In 2023, global natural gas trade increased, net pipeline trade increased to 475 bcm and LNG trade increased to 537 bcm. In 2023, the top three natural gas exporters were Russia with 139 bcm, Qatar with 128 bcm and the USA with 127 bcm, while the top three importers were China with 160 bcm, Japan with 91 bcm and Germany with 77 bcm. As can be seen, China's industrial and energy production data play an important role in the balance of natural gas supply and demand. Russian gas, which was cut off from pipelines to Europe due to the war in Russia and Ukraine, and other developing markets are causing an increase in LNG imports.
Global natural gas demand continued to grow by increasing by 59 bcm (1.5%) in 2023 and is expected to continue to grow with an additional demand increase of approximately 87 bcm (2.1%) in 2024. While consumption increased in many regions in 2023, with 32 bcm (3.3%) in Asia, 28 bcm (4.7%) in the Middle East and 14 bcm (1.2%) in North America, there was a decrease of 31 bcm (-6.3%) in Europe and 2 bcm (-3.7%) in Australia. In 2024, demand growth is expected to continue to come from Asia with an increase of approximately 43 bcm (4.3%), the Middle East with an increase of 29 bcm (4.7%) and North America with an increase of 8 bcm (0.7%). The change in global natural gas trade, problems in global or production regions, and the shift towards nuclear and renewable energy sources will affect the supply-demand balance in the coming period and therefore prices.
Global natural gas production also grew by 19 bcm (0.5%) in 2023 compared to 2022 levels, and supply is expected to continue to grow by 96 bcm (2.4%) in 2024. Growth in 2023 will largely be driven by an increase of 52 bcm (4.3%) in North America, 16 bcm (1.9%) in the Middle East and 3 bcm (0.8%) in Asia, offsetting a supply decline of 18 bcm (-7.8%) in Europe. In 2024, growth is expected to come from the Middle East with approximately 26 bcm (3.7%), Asia with 17 bcm (2.4%), North America with 12 bcm (1.0%) and Europe with 2 bcm (0.9%).
The US became the world’s largest net LNG exporter in 2023, surpassing both Australia and Qatar to reach 117 bcm exports. While US volumes primarily flow to Europe, Australia and Qatar export more to Asia than to Europe due to past agreements and geographical advantages. Europe and Asia remain two net importing markets.
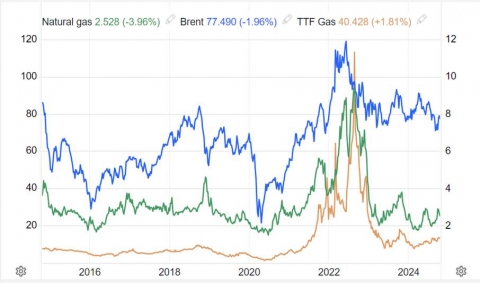
While natural gas prices generally show developments in relation to oil prices, environmental sensitivities, development of LNG trade, new production basins and pipelines, taxes and restrictions may cause changes in this relationship in the upcoming period.
In the graph below; You can see the 10-year Henry Hub (USD/mmBTU), TTF Dutch (EUR/Mwh) and Brent Oil (USD/Bbl) price changes.
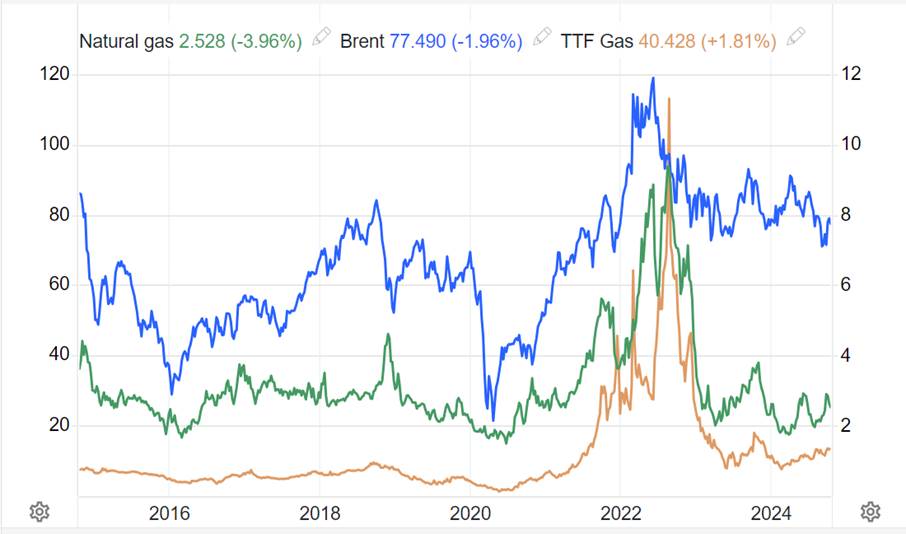
Sources: BOTAŞ, EPDK, IGU
- Log in to post comments